Spread, standard deviation, and data displays

Lesson progressPractice problems 0/5
Difficulty
Intermediate
Estimated time
55 minutes
Techniques
StatisticsSpreadRangeStandard-deviationDot-plotsBox-plotsHistogramsData-transformations

What you’ll learn

  1. Calculate and compare the range of one-variable data.
  2. Interpret standard deviation as a measure of typical distance from the mean.
  3. Compare distributions by center and spread as separate features.
  4. Read exact values from dot plots, medians and ranges from box plots, and intervals from histograms.
  5. Identify what a data display does not reveal.
  6. Predict how shifts and scaling, including negative scaling, affect center and spread.
  7. Use a Desmos list to check a comparison when calculation adds value.

Why this matters on the SAT

Separate consistency from average performance

Two data sets can have the same mean and still tell very different stories. One may cluster tightly around the mean, while the other varies widely. SAT questions test whether you can separate center, where the data are located, from spread, how far apart the values are.

The range is the maximum value minus the minimum value. Standard deviation describes how far the values in a data set typically lie from the mean. A smaller standard deviation means tighter clustering around the mean. A larger standard deviation means greater spread.

SAT example

Data sets P and Q each contain 77 scores.

P:6, 8, 10, 10, 10, 12, 14P: 6,\ 8,\ 10,\ 10,\ 10,\ 12,\ 14
Q:2, 6, 10, 10, 10, 14, 18Q: 2,\ 6,\ 10,\ 10,\ 10,\ 14,\ 18

Which statement correctly compares the means and standard deviations of the two data sets?

  1. A

    The mean of P is greater, and the standard deviations are equal.

  2. B

    The means are equal, and P has the greater standard deviation.

  3. C

    The means are equal, and Q has the greater standard deviation.

  4. D

    The mean of Q is greater, and P has the greater standard deviation.

Fast Desmos solution

Both data sets balance around 1010, so both means are 1010. The values in Q extend farther from 1010 in both directions. Therefore, Q has the greater standard deviation, and the answer is C.

Desmos can confirm the comparison. The lower row of points represents P and the upper row represents Q. The stdevp(...) values are not the starting point. The visible spread already determines which is larger.

SAT questions usually emphasize interpreting and comparing standard deviation rather than calculating it by hand. Desmos provides stdev(...) for sample standard deviation and stdevp(...) for population standard deviation. The equal-size comparisons and transformation questions in this lesson lead to the same conclusion under either convention, so the calculators use stdevp(...) consistently as a selective check after you have reasoned about the spread.

This lesson extends mean, median, and frequency tables.

Calculator loads as you approach
The upper data set reaches farther from the shared mean, so its standard deviation is greater.

When should you use Desmos?

Choose the shortest method that supports the exact claim in the question.

Use hand reasoning when…

  • a dot plot, box plot, or histogram makes the comparison visible;
  • every value receives the same addition or subtraction;
  • every value is multiplied by the same factor; or
  • selected values keep the same total and move closer to or farther from the unchanged mean.

Use a Desmos list when…

  • the problem gives raw values that are awkward to compare;
  • two equal-size data sets have similar-looking spreads; or
  • calculating the range or checking stdevp(...) is faster than tracking every distance.

Do not invent exact values from a histogram. A bar gives the number of observations in an interval, not the exact values inside that interval.

Check your understanding:

One question shows two symmetric dot plots with the same center, and one plot clearly extends farther from the center. Another question gives two unsorted lists of 2020 decimal values each. Which method is stronger for each problem?

1. Read what each data display tells you

The SAT uses dot plots, box plots, and histograms to show one-variable distributions. Each display reveals different information.

DisplayWhat you can readWhat it does not show

Dot plot

Every observed value and its frequency

Large data sets can become crowded

Box plot

Median, minimum and maximum for finding range, and broad distribution

Individual values, frequencies, mean, and standard deviation

Histogram

The number of values in each interval and the overall shape

Exact values within each interval

On a box plot, the line inside the box marks the median, and the marked endpoints give the minimum and maximum used to find the range.

A box plot compresses a distribution, so it does not show how individual values are arranged. You can compare medians and ranges directly, but you cannot determine the exact mean or standard deviation from a box plot alone.

Turn a raw list into a visible distribution

Suppose

R=4, 5, 5, 6, 7, 8, 8, 8, 11.R=4,\ 5,\ 5,\ 6,\ 7,\ 8,\ 8,\ 8,\ 11.

Enter the values as a list, then use dotplot(R) to see every observation. The smallest value is 44 and the largest is 1111, so

range=114=7.\operatorname{range}=11-4=\boxed{7}.

After reading the dot plot, replace dotplot(R) with boxplot(R) to inspect the compressed distribution. Keep one visualization active at a time so the displays do not overlap.

The dot plot shows all three occurrences of 88. The box plot makes the median and broad spread easy to scan, but it removes the individual frequencies.

Try it yourself:

Before replacing dotplot(R) with boxplot(R), predict what will happen to the minimum, median, maximum, and exact frequencies. Then make the change and check your prediction.

Check your understanding:

A histogram shows 1212 values in the interval 10x<2010\le x<20 and 88 values in the interval 20x<3020\le x<30. Can you determine the exact mean, median, or range from this information? What can you determine about the median?

Common mistake:

Reading a histogram bar height as a data value. The horizontal interval contains the data values. The bar height gives how many observations fall in that interval.

Calculator loads as you approach
Read the dot plot, then replace dotplot(R) with boxplot(R) to compare its median and range.

2. Compare center and spread separately

A complete comparison answers two different questions:

  1. Center: Which distribution is located higher or lower?
  2. Spread: Which distribution is more or less variable?

Consider

A:0, 4, 5, 5, 5, 6, 10A: 0,\ 4,\ 5,\ 5,\ 5,\ 6,\ 10

and

B:0, 0, 4, 5, 6, 10, 10.B: 0,\ 0,\ 4,\ 5,\ 6,\ 10,\ 10.

Both data sets have mean 55. Both also have range 100=1010-0=10. However, B places more values at the endpoints, farther from the mean. B therefore has the greater standard deviation.

Range uses only the two endpoints. Standard deviation responds to how all values are distributed around the mean. Two data sets can therefore have the same range and different standard deviations.

Useful comparison language:

  • same mean, different standard deviations: same center, different spread;
  • different means, same standard deviation: shifted centers, equal spread;
  • different means and standard deviations: both center and spread differ.
Check your understanding:

Data set C is 18,19,20,21,2218,19,20,21,22. Data set D is 12,16,20,24,2812,16,20,24,28. Compare their means and standard deviations without calculating the standard deviations.

Common mistake:

Assuming equal ranges mean equal spread. Equal ranges only confirm equal distances between the endpoints. The values between those endpoints can be arranged very differently.

Calculator loads as you approach
Equal means and equal ranges do not force equal standard deviations.

3. Predict shifts, reflections, scales, and targeted changes

You often can answer a transformation question without entering any raw data.

If cc is added to every value, the mean and median each increase by cc, while the range and standard deviation stay the same. Every value and the mean move together, so the distances from the mean do not change.

If every value is multiplied by a number kk, the mean and median are multiplied by kk, while the range and standard deviation are multiplied by k|k|. A negative multiplier also reflects the data by reversing their order, but spread remains nonnegative.

TransformationMean and medianRange and standard deviation

Add cc to every value

Add cc

Unchanged

Multiply every value by kk

Multiply by kk

Multiply by k|k|

Define

E=4, 6, 8, 10, 12.E=4,\ 6,\ 8,\ 10,\ 12.

Then define F=E+7 and G=-3E. The list F is a shift, so it has the same spread as E. The list G is a reflection and a scale, so its mean changes sign while its range and standard deviation are three times those of E.

Check your understanding:

Data set A has mean 5252 and standard deviation 66. Data set B is created by adding 88 to every value in A. Data set C is created by multiplying every original value in A by 1.5-1.5. What are the mean and standard deviation of B and C?

Common mistake:

Adding a constant to the standard deviation. A shift changes the location of the data, not the distances between values or their distances from the shifted mean.

Calculator loads as you approach
Adding shifts the center without changing spread; multiplying changes both center and spread.

Change only some values

When only some values change, do not apply the whole-data rules. Instead ask:

  1. Does the total change? That determines the direction of the mean.
  2. Do the middle positions change? That determines the median.
  3. Do the endpoints change? That determines the range.
  4. If the mean stays fixed and every changed value moves closer to it, the standard deviation decreases. If every changed value moves farther from it, the standard deviation increases. For mixed changes, or when the mean changes, compare the whole new distribution or use Desmos.

4. Example: Keep the mean, reduce the spread

Worked example

Data set A contains 1212 values and has a mean of 3030. Two of its values are 1212 and 4848.

Data set B is created by replacing 1212 and 4848 with 2424 and 3636, respectively. All other values remain unchanged.

Which statement correctly compares the mean and standard deviation of data set B with those of data set A?

  1. A

    The mean of B is greater than the mean of A, and the standard deviations are equal.

  2. B

    The mean of B is equal to the mean of A, and the standard deviation of B is greater than the standard deviation of A.

  3. C

    The mean of B is equal to the mean of A, and the standard deviation of B is less than the standard deviation of A.

  4. D

    The mean and standard deviation of B are both less than those of data set A.

Step 1

Compare the replaced totals

The two original values have total 12+48=6012+48=60. The two replacement values also have total 24+36=6024+36=60. The number of values and the total both stay the same, so the mean remains 3030.

Step 2

Compare distances from the mean

The original values are each 1818 units from the mean because 3012=1830-12=18 and 4830=1848-30=18. The replacement values are each only 66 units from the same mean because 3024=630-24=6 and 3630=636-30=6. All other values remain unchanged. Moving these two values closer to the unchanged mean decreases the standard deviation.

Step 3

Match both conclusions

The mean stays the same, and the standard deviation decreases. Therefore, the answer is C.

No calculator calculation is needed. The equal replacement totals settle the mean, and the shorter distances from 3030 settle the spread.

Common mistake:

Assuming that changing two values must change the mean. The mean depends on the total. Replacing values with the same combined total preserves the mean.

Finish the solution

The distance scale factor is entered. Decide how the addition affects spread, then finish the calculation.

Find the transformed standard deviation

Finish the solution

A data set has a standard deviation of 66. A new data set is created by multiplying every value by 1.5-1.5 and then adding 88 to every result.

What is the standard deviation of the new data set?

First steps

  1. The distance scale factor 1.5|-1.5| is entered.
  2. Decide whether adding 88 changes the spread.
  3. Apply the scale factor to the original standard deviation and submit the result.

Finish it

Calculator loads as you approach
The distance scale factor is ready. Multiply it by the original standard deviation.

Practice problems

SAT practice problems

Compare center and spread separately. Read only what a display provides, apply whole-data transformation rules only when every value changes, and use Desmos when calculation genuinely shortens the comparison.

Compare ranges from box plots

Practice problem

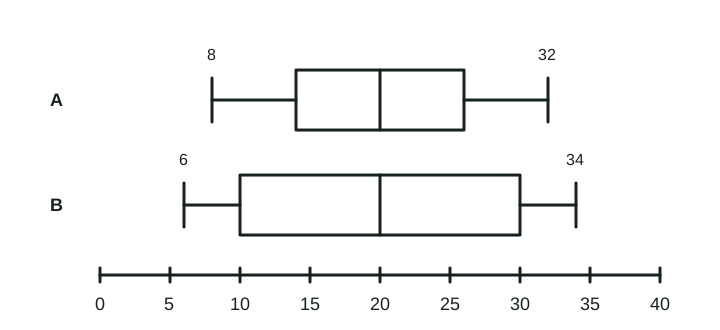
The box plots summarize data sets A and B.

Two box plots with equal medians at 20. Data set A has minimum 8 and maximum 32; data set B has minimum 6 and maximum 34.

The range of data set B is how much greater than the range of data set A?

Calculator loads as you approach
Read each pair of whisker endpoints, then compare the two ranges.

Transform mean and standard deviation

Practice problem

Data set X has a mean of 4848 and a standard deviation of 55. Data set Y is created by replacing every value xx in data set X with

y=1.6x12.y=-1.6x-12.

Which statement correctly gives the mean and standard deviation of data set Y?

Answer choices
Calculator loads as you approach
Use the calculator for the arithmetic after identifying the effect of each operation.

Interpret a histogram

Practice problem

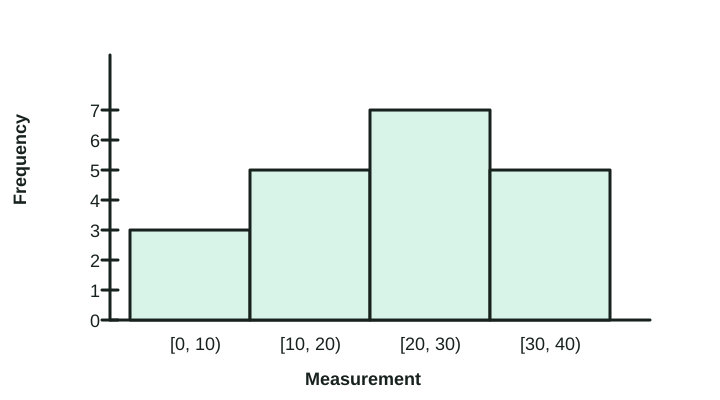
The histogram summarizes 2020 measurements.

Histogram with frequencies 3, 5, 7, and 5 in the intervals 0 to less than 10, 10 to less than 20, 20 to less than 30, and 30 to less than 40.

Each interval includes its left endpoint but not its right endpoint. Which statement must be true?

Answer choices

Compare two raw distributions

Practice problem

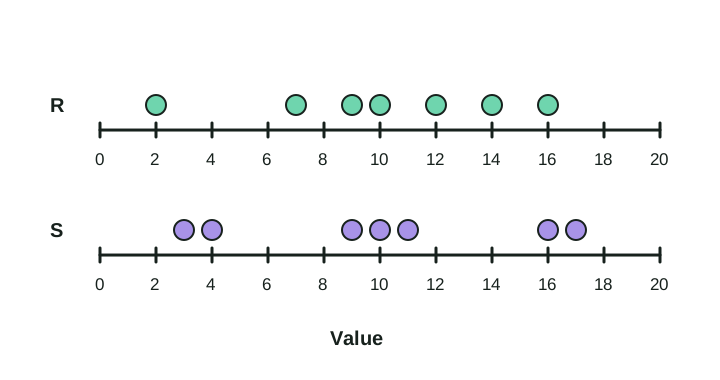
The dot plots show data sets R and S. Each data set contains 77 values.

Dot plots for R containing 2, 7, 9, 10, 12, 14, 16 and S containing 3, 4, 9, 10, 11, 16, 17.

Which statement correctly compares the means, ranges, and standard deviations of the two data sets?

Answer choices
Calculator loads as you approach
Enter each list once and compare its mean, range, and standard deviation.

Finish the lesson

5 practice examples left

Finish the remaining questions correctly to complete this lesson.

Quick recap

  • Center and spread answer different questions. Equal means or medians do not imply equal variability.
  • Standard deviation describes typical distance from the mean; larger standard deviation means greater spread.
  • Dot plots preserve individual values, box plots support median and range comparisons, and histograms preserve interval counts.
  • Adding the same constant to every value shifts center but leaves range and standard deviation unchanged.
  • Multiplying every value by kk multiplies center by kk and spread by k|k|.
  • When selected values change, first check whether the total and mean stay fixed.
  • Use Desmos lists and stdevp(...) when calculation improves the comparison, not when a display or transformation rule already settles it.

Next lesson

Solve percent problems in Desmos

Translate percent statements directly into equations and solve them in Desmos.

Start next lesson

Free Practice

Free question bank practice problems

Standard Deviation and Data Displays with Desmos | aniko.ai